Simplified Heatmap using Excel[ | ]
Description[ | ]
In this tutorial you will learn how to create a data-dumping functionality in your custom map. You will also learn how to process it in GIMP and Excell 2003 (or similar image management/spreadsheet software) into useful diagrams and statistics. This tutorial is created around SC2, but it can be used for all kinds of testing. I have used this method when I have tested performance of web-pages and web games.
The final result[ | ]

A simplified heatmap.
Hints[ | ]
- Real heatmaps sum values in a region, this is more of a scatter plot.
Tools[ | ]
You will need access to the SC2 editor (duh), Excell 2003 (or other spreadsheet software). You will need some skills in making triggers in the editor, as well as familiarity with excell. You will also need Gimp or similar to convert a .tga file into a .jpeg.
- Sample map and Excel files can be found at http://www.sc2mapster.com/assets/sc2-map-analyzing-framework/
How To[ | ]
The goal is to create a "process" that with as little hands on editing as possible generates answers to your questions of user behaviour. One way to do this is to look at replays. Replays only show one game at a time. Through this process, data from several games will be overlayed so that you can detect patterns and change you map accordingly.
- Formulating the question
- Creating the trigger package in the SC2 Editor
- Adding it to the map you want to test
- Run some tests
- Manage the outputs
- Create a spreadsheet document
- Do the analysis and conclusion
1. Formulating a question[ | ]
The first question is to formulate the analysis question. My question in this tutorial is "Where on the map does the largest battles take place?". To do this, I will create a heatmap of death-events.
2. Creating the trigger package in the SC2 editor[ | ]
The content of the trigger package can be seen in the pictures below. I will not go into detail in how to create the actual items in there since that is out of scope of this tutorial. I will explain the contents though.

Picture 1. Overview of the triggers.

Picture 2. Variables in the record.

Picture 3. The "Statistic" variable, based on the "Statistic" Record
Picture 4. A custom function that adds data to the debug file.
Picture 5. The custom action that generates a header.
Picture 6. The setup trigger
Picture 7. Data collecting trigger: reacts on unit death.
Picture 8. The debug file, ready to be imported into Excel.


- Picture 1. These are the triggers that you should create.
- Statistic (Record): a definition of a custom record, containing some basic data.
- statistic <Record - Statistic>: the variable that contains the record. This is neccessary to make use of the Record.
- statisticTextArrayToDebugFile(): takes a heap of text items and combines them into one, with a delimiter between each item.
- statisticPushHeader (action): adds a header to the debug file. Very useful if you create a lot of debug files.
- statisticOnGameStart (trigger): This trigger fires when the map is initializing and will start the collection of data.
- statisticOnUnitDeath: a sample data generating trigger. Every time a unit dies the event is logged.
- Picture 2.
- GameId: A number used both in print on the screen ingame, as well as the debug files filename. If you want to create a new debug file every time somebody plays a game, make the gameId random. If you want to avoid filling up the users computer with nonsense, make it a static 0 or something.
Test name: Its the first thing posted in the debug file.
- EventNr: is just a counter used for indexing. It is not needed in the rest of the tutorial but can sometimes be good to have, like when importing to databases. You can remove it if you like.
- Delimiter: The value of this should be a simple semicolon [;]. Semicolon is used as a delimiter both when importing to databases and when importing to Excell.
- isHeaderLine is used to print a first line of column titles. The default value should be true.
- Picture 3. The record variable - a reference to the statistic record. We only need one, so it is no array.
- Picture 4. A custom function named statisticPushTextArrayToDebugFile.
This function returns "void" and is of a actions type. It has 10 elements, which are all text elements. Basicly, what it does is that it combines all text elements while using the delimiter defined in the record to separate them. Then it prints the contents to the debug file, without displaying this information on the screen.
- Picture 5. A custom function named statisticPushHeader.
To make the debug file tracable, some information is pushed to the top of it. This information contains the map size, description and other things, defined in the record. It also prints some information about players - which ones are active and such, what their names and battle.net player handles are. The last line pushes a simple "******************" string to the debug file, just to mark that the actual game content begins. Note that i am measuring the coordinates in relation to the entire map, not just the playable area.
- Picture 6. OnGameStart trigger.
This trigger fires when the map i setting up. If you have more complex initialization, you might want to add a "wait" somewhere, so that the other triggers can finish and create the players before the statisticPushHeader is called. It also creates a small transparent dialog item, containing the debug files name, so that you can find it more easily (since this template creates a new debug file for every game played).
- Picture 7. The OnUnitDied trigger.
What I wanted to know was where units died. So this trigger pushes data to the debug file about these things. I created some variables for easier reading. The lines are very long, so the contents are shown in the tooltips. First, i check if this is the first line. If so: add a header row. The parameters are the column titles, such as "Timestamp" and "Killing player index". This will make interpretation of the data much easier. After this I set the isHeaderLine boolean variable to false. I only want one header. The next part is to push the data row containing information about the death-event. The data that i am pushing is: timestamp, dead player index, killing player index, type of dead unit, type of killing unit, position x of dead unit, position y of dead unit. I leave the two last parameter slots empty, since i dont feel like i need them. There is quite a lot of conversion going on here. It can be tricky to figure out what kind of data is accessible from where. All parameters have to be converted into "text" though, before sent to the push-function. Note that i am measuring the coordinates in relation to the entire map, not just the playable area.
Implementation into your map project[ | ]
Copy and paste the Statistics folder to any map you want to analyze.
Generate data[ | ]
To test the map, publish your map online and try it out with friends or try it offline. Play a couple of games and try some different approaches to the game. In this tutorial, I have played my own map "HercMerc - Cleaning up the swamp" a couple of times offline.
Since the debug files are generated also from online games, you can ask friendly people to try your game and send them the debug files.
Managing the outputs[ | ]
The debug printouts are located somewhere in your SC2 folder, or in your account folder if you play on battle.net. They should look something like this:
Create a spreadsheet document[ | ]
Create a spreadsheet document. I am using Excell 2003, but you can probably use OpenOffice or similar. From inside the document, open the textfiles. You might have to change the filetype to "any" to find the .txt files. During importing there are two things to do:
Pic8. Designating a tab delimiter. I'm using the swedish version, but you hopefully get the idea. 1. Set the tab delimiter marker to semicolon [;] (or the delimiter you decided to use in the editor).
Pic9. If I set the settings to "Allmänt" which means "common" or "default", the importer tells me that it will convert textfields with "number" letters into number values. 2. Try to make sure the columns that contain numbers, such as coordinates, are imported as number values. When it looks ok, import. To double check that the import went well: try to sum up to value cells. If the result is calculated, then they are numbers. If not, you will need to convert the values from text type into value types. Search online if you don't already know how to do this. Once you have the file imported and numbers interpreted as numbers, repeat this step for all the debug files.
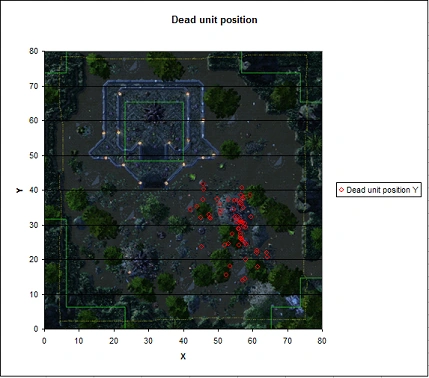
Create a heatmap[ | ]
I want to create a heatmap of death events. For this I need a map backdrop. In the editor, I navigate to Data/Export map Image.
Apply the settings you want. Make an image of the "entire map", not just the playable areas. This is important to get proportions right. I then open it in Gimp and export it (again) as a jpeg. In Excell, I create a new "Scatter diagram".
I add one dataseries to it by selecting the coordinate columns from one of my sheets.
I then click finish. The result looks a bit crude:
I go into one of the data tabs, and note the size of the map:
The first value is the x-size and the second is the y-size. In the diagram, I open up the axis-settings by doubleclicking on an axis.
Again, an opportunity to learn some Swedish :P. Change the scales into min=0 and max = 80 (or the size of your map). Do this for both the x and y axis.
It now looks better, but not done. By doubleclicking the gray area, I get the settings of the diagram background. Change the background into an image. In my version, i click the button underneath the colors, called "fill effects"
In here, i choose the "image" tab, and click "select image". I choose the exported jpg with the map picture that I prepared earlier.
Excel is nice and handles the scaling of the background. Now I change some colours, labels, and axis names to make the thing look a little more professional: